Find the gaps before you bid.

Settlement Mapping maps the settlement clusters in your region from an annual high-resolution pass, so you rank build priority from what has been built, not from census boundaries and a population grid.

Diagram: settlement clusters inside a coverage footprint are filled, the gaps outside it are outlined
Inside your footprintGap
GSD
0.5–2 m (high-res)
Cadence
Annual
Platform
High-res satellite
Spectral
RGB
The job today

Where the census boundaries run out

You pull the enumeration areas, lay the population grid over them, then put your coverage footprint on top and read off what is uncovered. The boundaries date from the last census. The grid shares a count across its cells, so it shows people in a cell with no roofs and nobody where a village went up since.

So you open the base map beside it and fix the worst cells by hand before anything goes into the ranking, and the ranking goes into a bid.
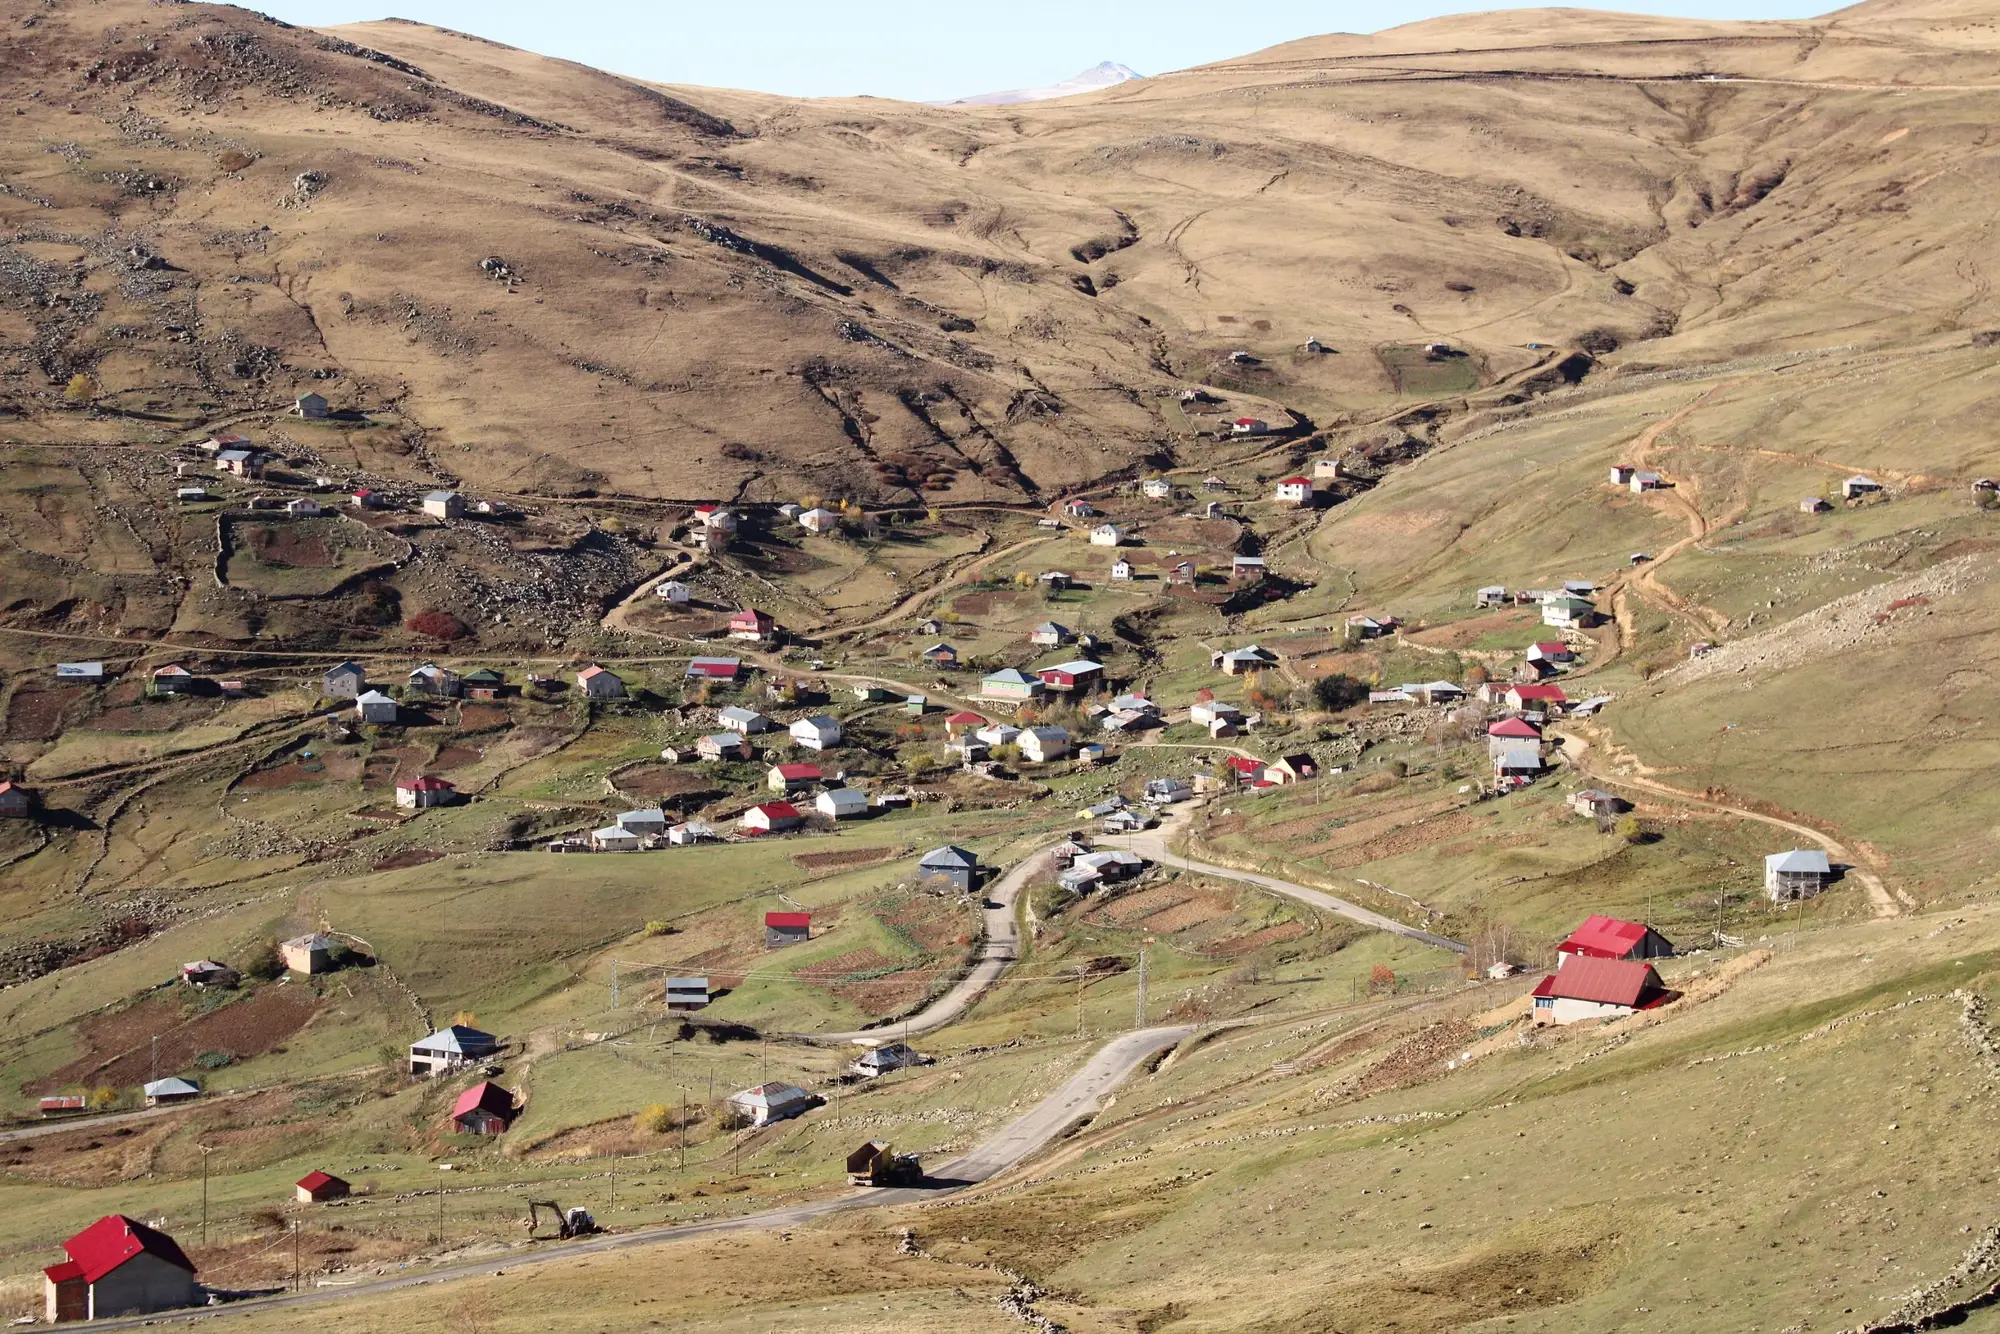
Houses scattered across a dry upland valley, linked by dirt tracks
Comparison

The ranking, step by step

  1. Defining the region

    Census and population grid

    You work from census enumeration areas or administrative boundaries, drawn to count people.

    With Settlement Mapping

    You send your region or bid boundary and get clusters inside it, wherever the buildings are, whatever the boundary lines say.

  2. Finding where people live

    Census and population grid

    The population grid spreads census counts over cells, so a settlement is a patch of shaded cells.

    With Settlement Mapping

    Each settlement cluster is segmented and classified from imagery of what is on the ground, with a location and an outline.

    Still yours

    Deciding which clusters count as a place worth serving.

  3. Sizing a settlement

    Census and population grid

    A cell value or an area total, with a modelled population behind it.

    With Settlement Mapping

    A size for each cluster by built extent. It tells you how big the place is, not how many people live there.

  4. Catching what changed

    Census and population grid

    New villages and extensions appear when the next census does, or when someone spots them on the base map.

    With Settlement Mapping

    A fresh pass every year, so growth since the last one is in the layer. Anything built after the pass waits for the next.

  5. Finding the gaps

    Census and population grid

    You overlay your coverage footprint on the grid and read off what falls outside it.

    With Settlement Mapping

    You do the same overlay on a cluster layer, and each cluster comes back flagged unserved or underserved against the footprint you supply.

    Still yours

    The coverage footprint itself, and what counts as underserved.

  6. Ranking for build or bid

    Census and population grid

    A ranking built from grid cells, corrected by hand against imagery before it is frozen.

    With Settlement Mapping

    A ranked list of clusters across the region to start from, for your build-priority sheet or the bid's target-area schedule.

    Still yours

    The final order, the site candidates, and the submission.

What you get

What you get for a region

  • Points and polygons

    Settlement cluster layer

    The clusters in your region as a point and an outline, with an ID. Answers the finding-where-people-live row. It opens as a layer in your GIS next to the footprint.

    Row 02Finding where people live
  • Built extent per cluster

    Cluster size estimate

    A size on each cluster from the area its buildings cover. Use it to tell a hamlet from a market town, not to count heads.

    Row 03Sizing a settlement
  • Flag per cluster

    Unserved and underserved flags

    Each cluster marked against the coverage footprint you send us. Answers the finding-the-gaps row.

    Row 05Finding the gaps
  • Table, region-wide

    Ranked priority list

    All the clusters in order of priority, with ID, location, size and flag. It is the start of your build-priority ranking, not the finished one.

    Row 06Ranking for build or bid
How it works

How a region runs

One pass per planning cycle

Send the region and your footprint, we map the clusters, you get the layer before your ranking is frozen.

  1. 01

    Region in

    Your region or the bid boundary, and the coverage footprint if you want clusters flagged against it.

  2. 02

    Imagery

    An annual high-resolution RGB satellite pass over the region, at 0.5 to 2 m.

  3. 03

    Analysis

    Settlement clusters are segmented and classified from the imagery, then sized by built extent.

  4. 04

    Delivery

    The cluster layer, flags and ranked list, for your GIS and planning tool. Timing is set against your planning cycle or the bid window.

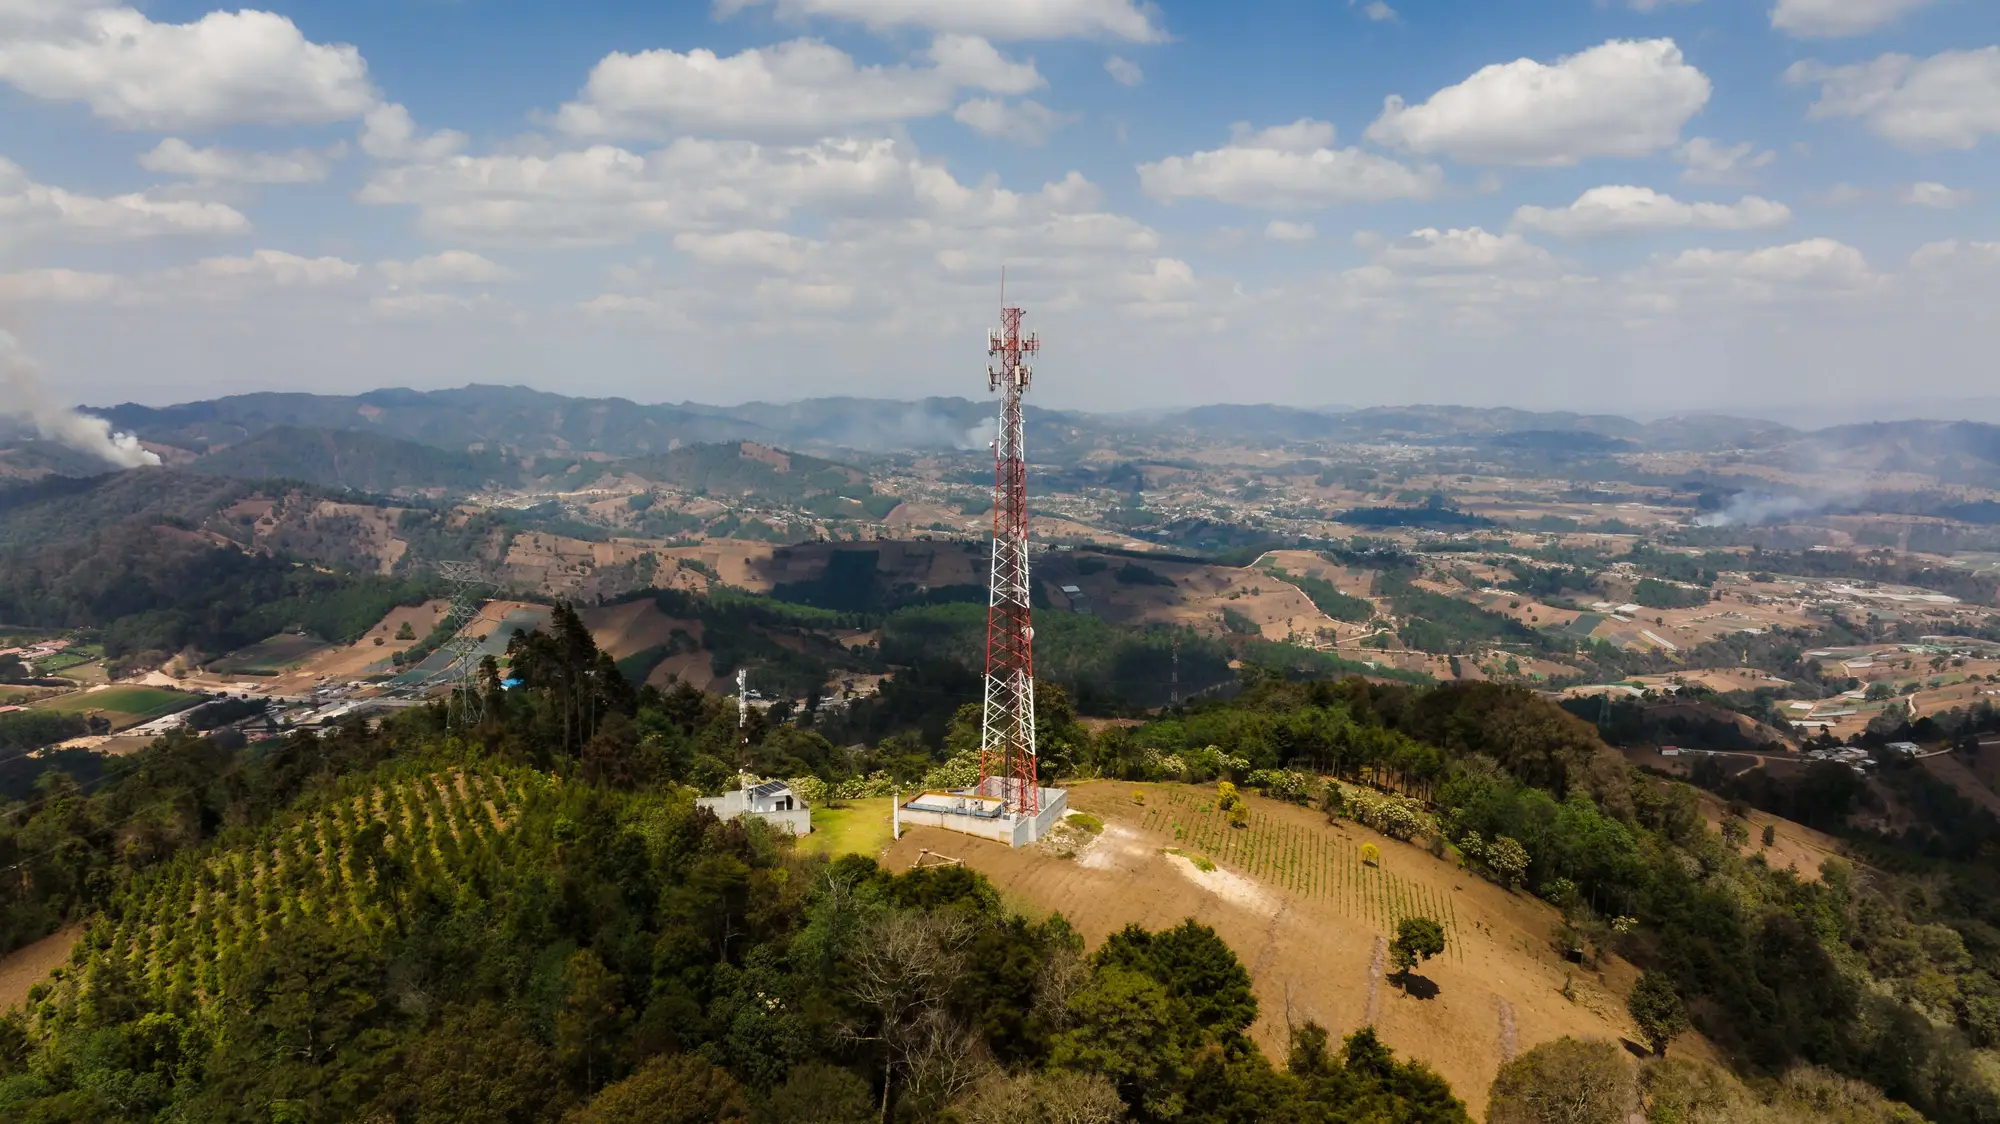
A lattice mast on a hilltop above rolling farmland and distant ridges
Where it fits in your workflow

Ahead of the ranking

Use the cluster layer in the step where you used to reconcile census boundaries and the grid. It becomes the base input to your build-priority ranking or the target-area list in a subsidy bid, on the same annual cycle as your planning.

Your radio planning, site candidates and the submission carry on as before.

Limits

Annual, so recent building is missing
One pass a year. A cluster built after the last pass does not appear until the next. The layer is as current as its pass date, and the pass date is on the delivery.
Resolution floor
The imagery runs from 0.5 to 2 m a pixel. At the coarse end a single hut is a pixel or two, so isolated dwellings and scattered homesteads can be missed. The method is aimed at groups of buildings, not lone ones.
Extent, not population
Size is built extent. It does not tell you how many people live in a cluster, how many households, or whether the buildings are occupied. Do not use it as a census figure.
No coverage detection
We do not detect your existing network coverage. You supply the footprint and we flag clusters against it.
Clouds and haze
Optical imagery needs a clear view. A cloudy season over the region can move the pass later or leave patches that need a second look.
Not a certified dataset
It feeds your bid and your planning. It is not a certified population dataset, and your programme may set its own data requirements for a bid.

Who it's for

Switch if

  • You plan rural build-out at an operator and your ranking starts from census boundaries and a population grid.
  • You run or advise a regulator's universal service fund and need a target-area list from what is built.
  • You already overlay your own coverage footprint and want a better settlement layer under it.

Stay with the census and grid if

  • Your bid rules require census population figures. Check your programme's data requirements first.
  • You need a head count or household number per place.
  • You want us to measure the coverage you already have.
FAQ

Questions before you switch

Does this replace census population counts?

No. It maps where buildings cluster. It does not estimate the population of a cluster, so keep your census numbers where a head count is required.

How do we check it against what we have?

Take an area you already know well, or one you have corrected by hand against imagery. Compare our clusters with your corrected cells and judge whether the layer is good enough to plan from.

How current is it?

Annual. A cluster built since the last pass will not be in the layer until the next one.

Does it detect our existing coverage?

No. You overlay your own coverage footprint, or send it with the region and we flag clusters against it.

What about very small or scattered dwellings?

Detection depends on the 0.5 to 2 m resolution. Isolated single buildings below what the pixel resolves can be missed.

Can we use it directly in a subsidy bid?

It is an input to the bid. It is not a certified dataset, so check what your programme accepts.

Will it load into our planning tools?

It comes as a GIS layer and a table. We do not write into your tools directly. If you need a particular file format, say so when you get in touch.

Who owns the layer and the imagery?

Ownership and licence terms are written into the agreement before anything is ordered. If your legal team needs to review them, ask early.

How is it priced?

The cost depends on the size of the region and the imagery source, and we quote for your region. We give no figure on this page.

Map your region.

Tell us the region or bid boundary and when the ranking has to be fixed. We will say whether the annual pass can meet that date.

Get started